
You put a new cabinet in a room, and the HCHO reading on your monitor starts to climb. You open a window and it falls. Close the window, and a while later it rises again. Is the cabinet responsible? Is the number high? And what should you do?
HCHO is formaldehyde, an invisible gas. Furniture made from wood-based boards, building materials and processes that involve heat, such as laser cutting plywood, can release it. A monitor's graph can help you look for a source and check whether your changes help. Keep two things in mind: how long a reading lasts matters, and a household sensor has measurement uncertainty.
Where formaldehyde comes from
In the cabinet example, the boards are a sensible place to start. Plywood, medium-density fibreboard (MDF) and particleboard combine wood with adhesive. Plywood uses thin layers, MDF uses wood fibres, and particleboard uses wood chips. Some adhesives contain formaldehyde-based resins, and the finished product can gradually release formaldehyde into the air. How much depends on the adhesive, manufacturing process and particular product. The label “MDF” alone cannot tell you. EPA: composite wood products
There may be other sources in the same room. Smoking, cooking, fuel-burning appliances, some paints and household products can also contribute. Notice when the graph rises and what you are doing at the time. WHO: indoor sources
Why the reading returns after you open a window
Opening a window dilutes the room air while the source remains. In our example, formaldehyde leaves through the open window and the reading falls. After you close it, the cabinet continues releasing gas and the concentration builds up again. One airing may help for only a short time.
Temperature and humidity matter too. In a study of wood-based materials, warmer and more humid conditions increased formaldehyde emissions. That helps explain why a cool morning and a warm afternoon can give different readings. Look at HCHO alongside temperature and humidity to see what changes together. Study: temperature and humidity There is more about moisture in the indoor humidity guide.
Can a 3D printer release formaldehyde?
Yes. A printer melts plastic filament, releasing gases and small particles into the air. Those gases can include formaldehyde, even when printing PLA.
The amount depends on the printer, filament and room. In one study, a desktop printer using ABS and PLA produced formaldehyde concentrations of about 2–3 µg/m³ (roughly 1.6–2.4 ppb). The ppb conversion is for 25 °C and standard atmospheric pressure. These were low concentrations under that experiment's conditions. Mendes et al., 2017 Another study detected formaldehyde in a workplace using ABS printers, with results that depended on the sampling location and other nearby activities. Workplace study, 2022 There is no single concentration that applies to all PLA or ABS printing.
I mostly print PLA and have not noticed the monitor respond as it does during laser cutting. I described that in my workshop article; I did not take laboratory samples. A flat HCHO graph does not establish that a printer releases nothing. A change may be too small for a household sensor to resolve, and the printer can still release other gases and particles.
Follow the printer and filament manufacturers' recommendations for placement and ventilation, and choose extraction equipment to suit those recommendations and your setup. If you use an enclosure, consider where its air goes. The NIOSH guide to safer 3D printing has further practical advice.
How much formaldehyde is too much?
The monitor displays HCHO in ppb, or parts per billion. A reading of 100 ppb means roughly 100 formaldehyde molecules for every billion molecules of air.
Official guidelines often use µg/m³: micrograms in a cubic metre of air. For formaldehyde at 25 °C and standard atmospheric pressure, 100 ppb is about 123 µg/m³, and 100 µg/m³ is about 81 ppb. NIOSH: unit conversion
A peak and an average tell you different things
Guidelines use the average concentration over time. The highest number on the screen cannot tell you that on its own. Consider two illustrative half-hour periods with the same peak:
A brief peak
Half an hour at the peak
On the left, the reading stays at 100 ppb for 5 minutes, then falls to 20 ppb. The half-hour average is about 33 ppb. On the right, it stays at 100 ppb for all 30 minutes, so the average is also 100 ppb. The peak is the same, but in the second case you breathe air at that concentration for six times as long. A number that flashes on the display cannot be compared directly with a 30-minute guideline.
These guidelines apply to homes. The average concentration over the stated period should not exceed the listed level.
| Guideline | Upper level | Averaging period | Purpose |
|---|---|---|---|
| WHO, 2010 | 100 µg/m³ ≈ 81 ppb | 30 minutes | Protection against eye, nose and throat irritation |
| Health Canada, short term | 123 µg/m³ ≈ 100 ppb | 1 hour | Protection against eye, nose and throat irritation |
| Health Canada, long term | 50 µg/m³ ≈ 40 ppb | 8 hours or longer | Protection against respiratory symptoms from repeated exposure, especially in children with asthma |
Table sources: WHO: formaldehyde chapter and Health Canada. The ppb values are approximate.
The longer you breathe the air, the more the sustained level matters. Health Canada's recommendation is 100 ppb for one hour, falling to 40 ppb for 8 hours or longer.
These values include a protective margin; they are not thresholds at which everyone develops symptoms. If averages repeatedly come close to or exceed them, investigate the source and improve ventilation, even if you feel fine.
There is also a guideline for a whole year. The UK's 2019 recommendation is 10 µg/m³, about 8 ppb, averaged over a year. UK recommendation, Table 1 A morning reading above 8 ppb does not establish an exceedance, and a few days of records cannot give you an annual average. Workplace limits and material emission-test results answer different questions; do not substitute them for residential guidelines.
How formaldehyde affects health
Formaldehyde can irritate the eyes, nose and throat. Repeated exposure to elevated concentrations over months or years may worsen asthma symptoms and contribute to coughing and wheezing, especially in children. Health Canada also reports links with airway inflammation and increased sensitivity to allergens. Long-term exposure can affect health below the concentrations that cause obvious irritation. Health Canada: health effects
The International Agency for Research on Cancer (IARC) classifies formaldehyde as carcinogenic to humans, meaning it can cause cancer. The evidence includes studies of workers exposed over long periods, often at concentrations above those found in homes. That is a reason to reduce exposure. A monitor reading cannot calculate your personal cancer risk, and exceeding a guideline does not mean that someone will inevitably become ill. US National Cancer Institute
If you repeatedly experience symptoms in a particular room, discuss them with a healthcare professional. Record what you feel, when it happens and what you are doing. A low HCHO reading does not rule out another cause, and smell alone cannot identify the substance.
How Aura AQ measures HCHO
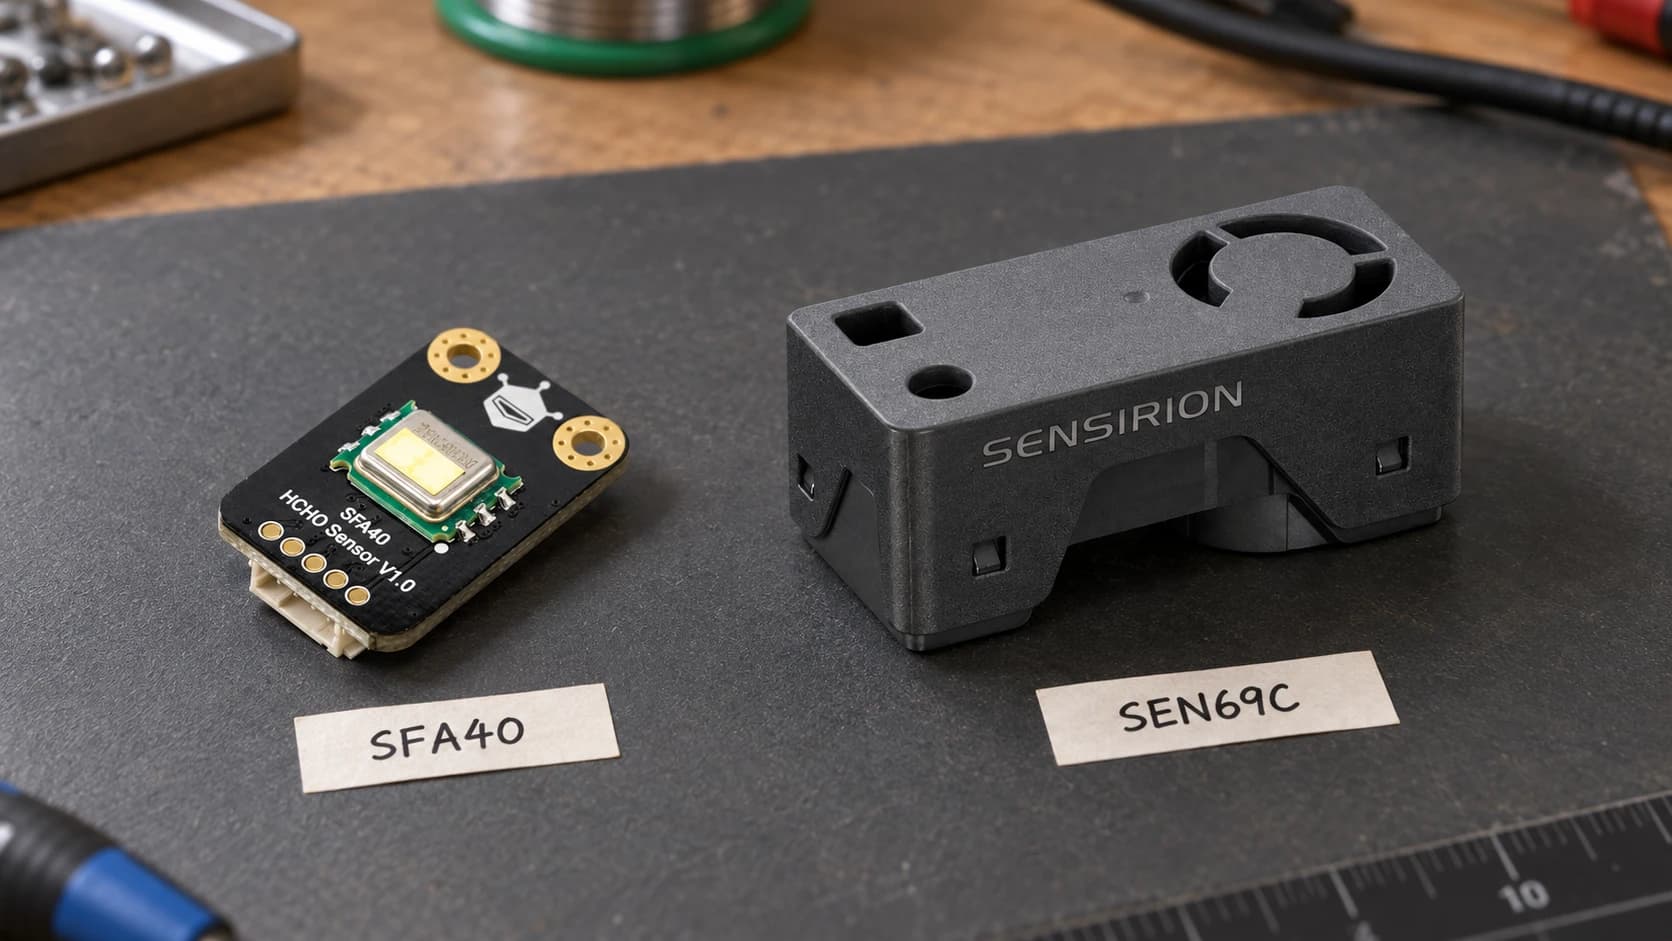
An HCHO-equipped Aura AQ uses a dedicated formaldehyde sensor. This can be a separate SFA30 or SFA40 module, or a SEN69C that combines HCHO sensing with particles, CO₂, temperature, humidity and VOC/NOx measurements. Sensirion SEN69C The SFA sensor contains an electrochemical cell: formaldehyde produces an electrical signal, which the module converts to ppb. SEN69C uses an SFA40 for its formaldehyde measurement.
The VOC Index responds to a mixture of gases and compares it with the recent background. It may rise after you use a cleaning product, but it cannot tell you how much formaldehyde is in that mixture. Sensirion: VOC Index If your build uses SEN66, you need a separate sensor for formaldehyde. Looking at both graphs can still be useful: do they rise together, or does only one change? I explain the indices in the VOC and NOx guide.
How accurate is the number?
For SFA40 and SEN69C, Sensirion specifies typical accuracy of ±20 ppb or ±20% of the reading, whichever is greater. That specification covers 0–200 ppb of formaldehyde in otherwise clean air. SFA40 datasheet SEN6x datasheet In practice:
- A single change of a few ppb is not enough to identify a new source. Look at how long it lasts and whether it repeats under similar conditions.
- A household sensor with this accuracy specification cannot verify an annual guideline of about 8 ppb.
- Do not subtract 20 from the reading. The accuracy specification does not mean the sensor detects nothing below 20 ppb.
- After power-on, the HCHO measurement typically needs about 10 minutes to meet the stated specifications.
- A mixture of gases from heated materials, or conditions inside an enclosure, may affect accuracy. A sensor datasheet does not validate the complete Aura AQ device.
The sensor needs free access to air. Heat from nearby components and condensation can interfere with measurement. SFA40 integration guide Independent studies of the earlier SFA30 include its response to other gases, but those findings cannot establish how SFA40 or SEN69C performs. SFA30 study SFA30 interference study
More sensor details: SFA35, SCREEK and operating conditions
SFA35 and the replacement for SFA30
Aura AQ continues to support SFA30. Sensirion's catalogue lists SFA40 as its successor, but the company's notice dated 2 December 2025 announced an SFA40-based SFA35 as a direct replacement for SFA30. The notice specifies the same form factor, communication interface and electrical characteristics. This describes the announcement; it does not confirm current SFA35 availability. Sensirion catalogue: SFA30 SFA30 replacement notice
Why firmware matters when comparing devices
On 4 September 2026, SCREEK reported a change to the conversion of sensor data in its SFA-40A. It said readings became about ten times higher and closer to its SFA30 readings. That report concerns SCREEK's device and does not establish that Aura has the same error. Agreement with another household sensor also does not prove accuracy. Record the module manufacturer and firmware version alongside the sensor model when comparing devices. SCREEK: SFA-40A firmware update
Temperature and humidity
For an operating SEN69C, Sensirion recommends 10–40 °C and 20–80% relative humidity, with a maximum dew point of 35 °C. Dew point is the temperature at which moisture starts to condense; this adds a limit on combinations of temperature and humidity. SFA40's operating range is 0–50 °C and 10–90% relative humidity. Both require conditions without condensation. For storing an unpacked SEN69C before testing, the specified conditions are 10–30 °C and 30–60% relative humidity. A fresh-air supply does not mean leaving the module outside in cold, damp weather. SEN6x: operating and storage conditions SFA40: operating conditions
What I saw while cutting plywood
While laser cutting one batch of alder plywood, my Aura AQ with an SFA40 showed about 100–110 ppb. With the Bambu Lab plywood I use, readings stay around 20–30 ppb, close to the room's usual background. I wrote about this in the article on air quality around laser cutters and 3D printers.
This was an observation in my workshop. I did not cut both materials under matching conditions, collect laboratory samples or calculate averages over equal periods. During cutting, the sensor also encounters a mixture of gases from heated material, whereas its accuracy specification uses otherwise clean air. These numbers cannot identify the adhesive or rank plywood products.
The difference was large enough to make me pay closer attention to material choice and to emissions escaping into the room instead of reaching the extraction system. Even an emission-test report for the finished sheet cannot tell you what it will release under a laser.
What to do about high readings
- Put the monitor where you breathe, and keep it there for the comparison. At an open window it may sample mostly outdoor air; above a hot machine it may sit in a concentrated plume. Neither position tells you much about the rest of the room. The monitor placement guide can help you choose a spot.
- Record what happens. Note when you open a window, turn on extraction or start printing or cutting. Keep temperature and humidity with the record.
- Change one condition at a time. If you swap the material, move the monitor and open a window together, you will not know which change mattered. Several observations under similar conditions are more useful than one impressive graph.
- Investigate the source. If you suspect furniture or a building material, ask the manufacturer for formaldehyde emission-test results and consider whether you can remove the item. Remember that a test chamber differs from your room.
- Improve ventilation. For printing and cutting, use suitable extraction to capture emissions near the process before they spread through the room. EPA: air cleaners for the home
- An air cleaner can supplement these measures if its filter has been tested for formaldehyde removal. The details below explain what to look for.
- Compare the graphs after making changes, during the next similar job or under similar room conditions.
Do not disable extraction, heat products or close up a room to make the reading rise for an experiment. Keep a room monitor out of dense smoke and exhaust ducts.
What will not help, or will not prove the air is cleaner
- A HEPA label. HEPA filters capture particles. Formaldehyde is a gas and needs a suitable gas-treatment material. EPA notes that even ordinary activated carbon performs poorly for formaldehyde compared with specialised media. Look for tests specific to HCHO, and check the filter's capacity and replacement requirements. EPA: technical review
- A fall in PM. If particle readings drop after you turn on a purifier, that does not establish that formaldehyde has fallen too. The particle guide explains that side of filtration.
- A disappearing smell. This does not prove that the air is clean.
- Houseplants. Experiments in small sealed chambers do not show that a few pots can clean an ordinary room at a useful rate. Keep the plants if you enjoy them, and plan ventilation separately. Review of houseplant studies
- Ozone-generating air cleaners. Do not use them in occupied rooms. EPA: air-cleaner guidance
When to arrange a laboratory test
If readings keep causing concern after you have checked obvious sources and ventilation, consider professional testing. This is especially useful when the result needs to support a decision about health, housing or a dispute with a supplier. Explain what happens in the room and the period you need to assess, so the specialist can choose a suitable sampling method.
One established method draws air through a sampling material treated with a reagent called DNPH, which captures formaldehyde. The laboratory then separates it from other compounds and measures how much accumulated during sampling. NIOSH: sampling method
The monitor's graph can help here too. It shows when readings tend to rise, which can help you choose a sampling period. Your notes about room conditions will help you repeat the measurement after making changes and compare the results.
A few words from me
I'm sorry we have run into these difficulties with the sensors. I do not yet have a definite answer for you, or a replacement I can recommend as equivalent in quality.
My newer SFA40 and SEN69C units have now settled and show roughly the same readings as my SFA30. But agreement between them does not establish their accuracy or explain what other owners are seeing.
I am continuing to test Aura's enclosure and sensor placement. I cannot rule out an effect from the design. I am trying to isolate the sensor from nearby heat sources and materials while keeping air access open. When I have results that support a useful change, I will publish an update explaining what I tested and what changed.