
PM0.5, PM1, PM2.5, PM4 and PM10: what do they actually mean?
A practical guide to particle readings: how PM0.5, PM1, PM2.5, PM4 and PM10 differ, why count is not mass, and what to do when they rise indoors.
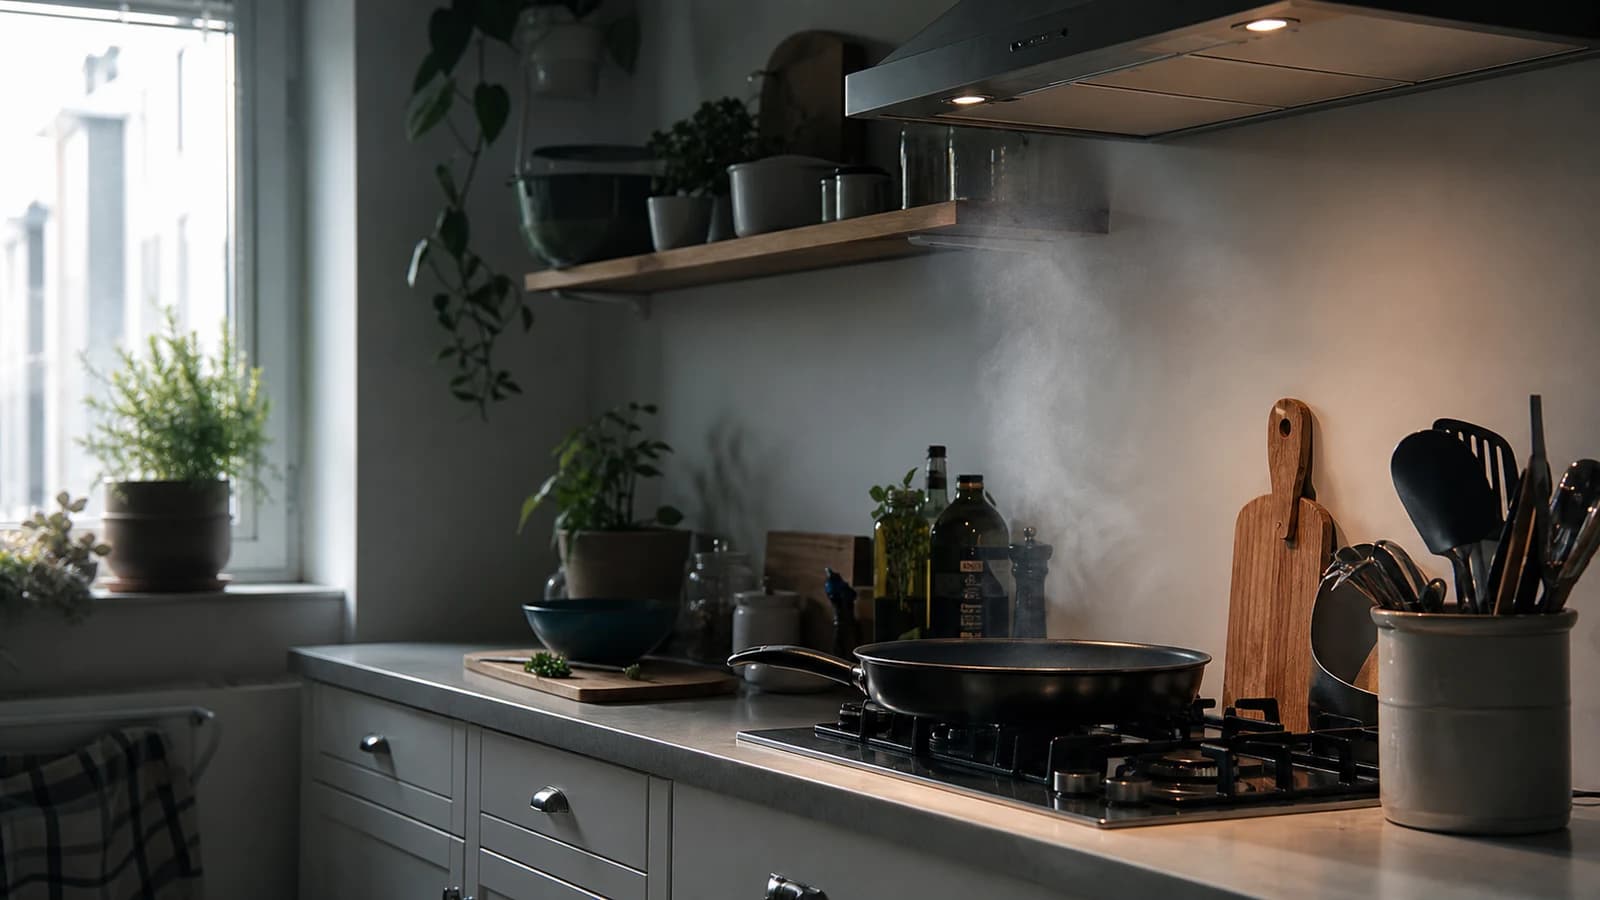
You fry something, the particle graph climbs, and the air still looks perfectly clear. Later, someone shakes a dusty blanket and a different part of the graph moves. Same room, different particles, several numbers, and one reasonable question: which one am I supposed to watch?
The useful answer is not “always watch the smallest number.” The PM channels describe overlapping particle-size ranges, and they do not all use the same unit.
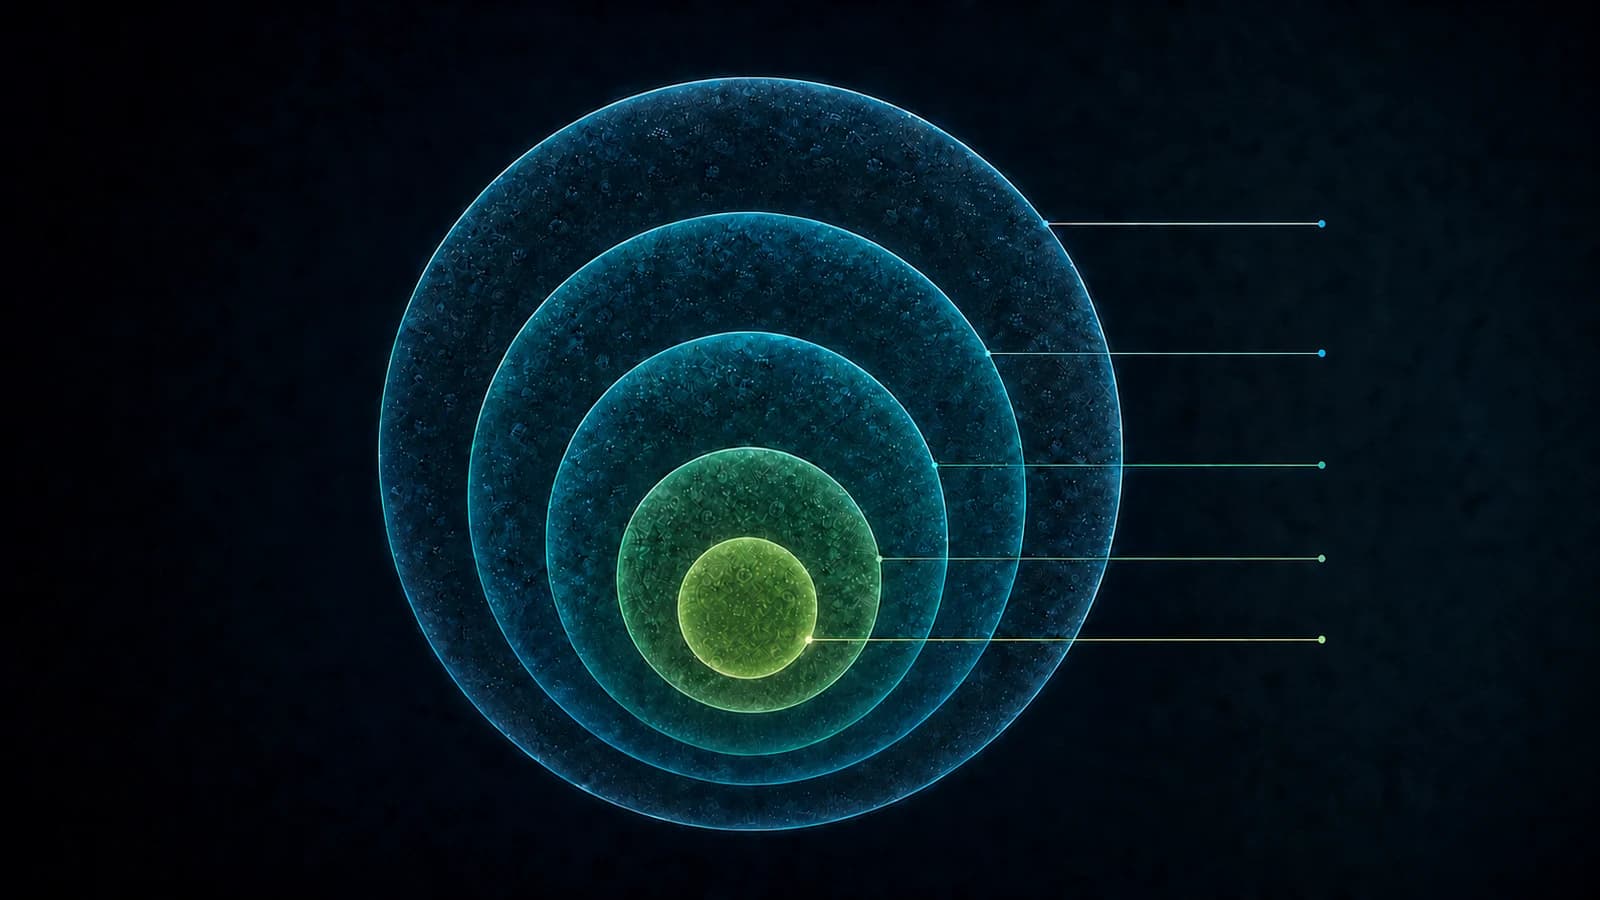
The PM labels are nested size fractions, not separate pollutants.
PM stands for particulate matter: tiny solids and liquid droplets suspended in air. PM2.5 includes the smaller particles represented in PM1, while PM10 includes the finer fractions too. Do not add the mass readings together.
Aura AQ shows PM0.5 as a particle count in #/cm³. PM1, PM2.5, PM4 and PM10 are estimated mass concentrations in µg/m³. Those units answer different questions and cannot be compared as one score.
One family of particles, five useful views
The US EPA defines particulate matter as a mixture of solid particles and liquid droplets in the air. It can include soot, smoke, dust, salt, organic material and many other things. PM is not one chemical, and one reading cannot identify what a particle is made from.
The size labels use aerodynamic diameter. In plain English, that is the size of an imaginary standard particle that behaves the same way in air. Shape and density matter, so a fluffy fragment and a compact sphere can share an aerodynamic size without looking alike under a microscope.
| Channel | What it represents on Aura AQ | Best practical use |
|---|---|---|
| PM0.5 | Detected small-particle count, shown in particles per cubic centimetre. | Spotting changes in submicron particle activity. It is not the same as an ultrafine-particle measurement. |
| PM1 | Estimated mass within the PM1 fraction. | Following fine aerosols from sources such as smoke and cooking. |
| PM2.5 | Estimated mass within the PM2.5 fraction. | The most widely used fine-particle health and outdoor-air reference. WHO publishes PM2.5 guidelines. |
| PM4 | Estimated mass within the PM4 fraction. | Context between fine and coarse particles. It roughly aligns with an occupational respirable convention, but is not a household safety limit. |
| PM10 | Estimated mass within the PM10 fraction. | Seeing the fine fraction plus more coarse material such as disturbed dust and some biological fragments. WHO publishes PM10 guidelines. |
The boundaries are sampling conventions, not tiny gates that sort every particle perfectly. A compact optical monitor estimates each fraction instead of physically collecting and weighing it.
One correction matters because it appears often online: PM0.5 is not another name for ultrafine particles. The EPA generally describes ultrafine particles as smaller than 0.1 µm. A PM0.5 count covers a much broader range and does not replace a dedicated ultrafine-particle instrument.
Count and mass are not the same story
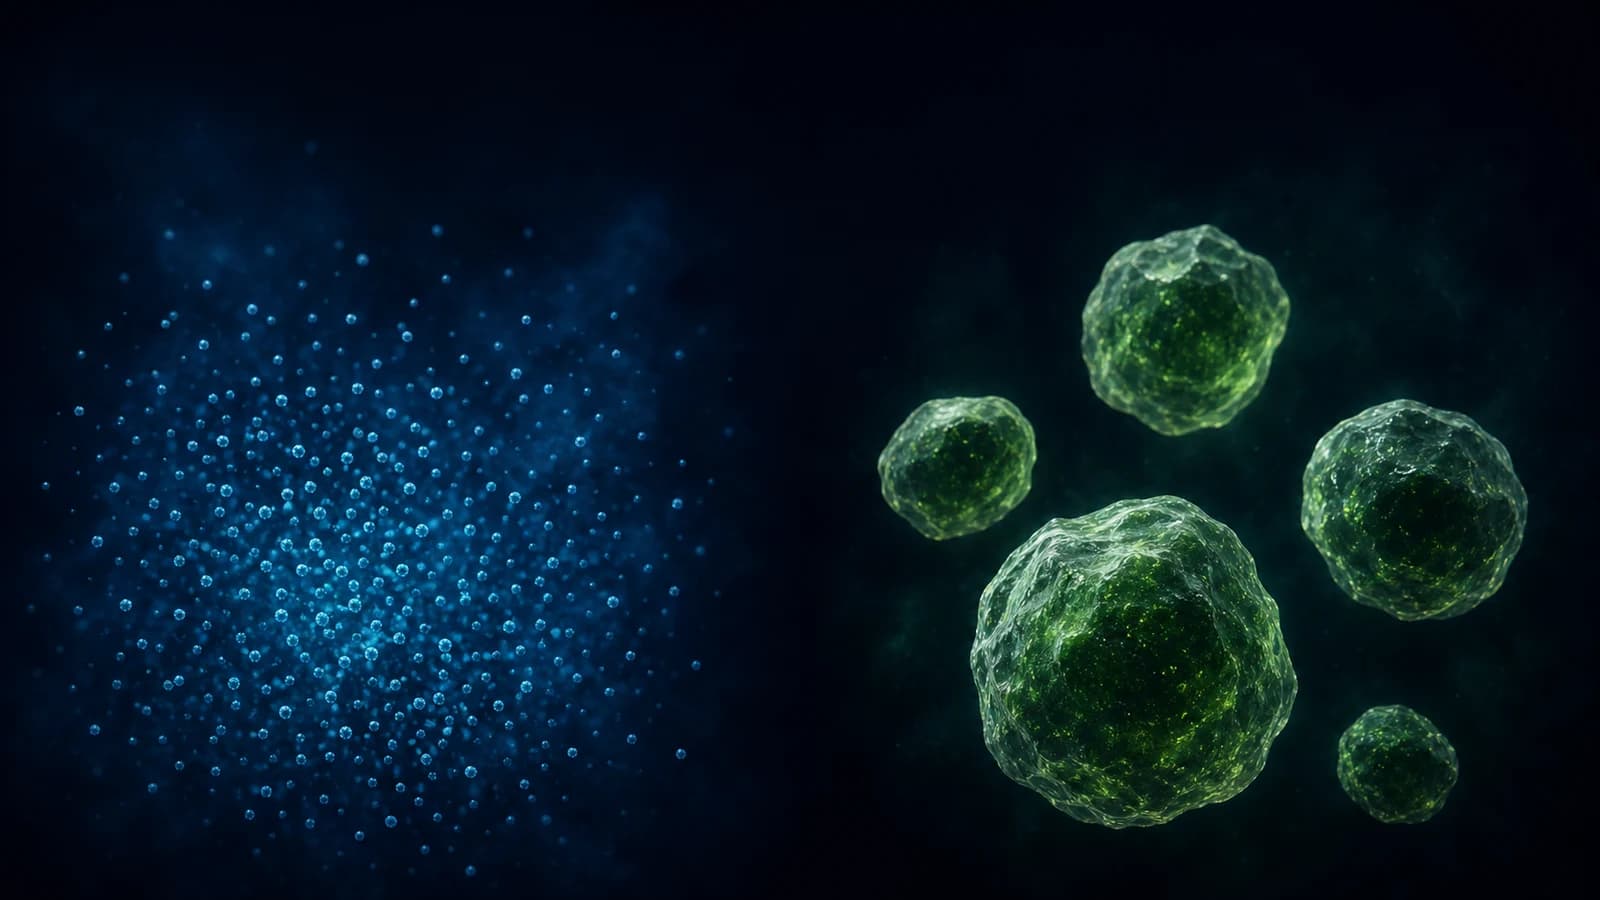
PM0.5 answers, roughly, “how many very small particles are being detected?” The mass channels answer “how much estimated particle mass sits inside this size fraction?”
That difference matters because particle mass grows with the cube of diameter. If two spherical particles have the same density, one 10 µm particle has roughly the mass of 1,000 particles at 1 µm. A 1 µm particle has roughly the mass of 1,000 particles at 0.1 µm.
A room can therefore contain a large number of tiny particles while the mass reading remains modest. A smaller number of coarse particles can move PM10 strongly because each one contributes much more mass. Neither view is “the real one.” They reveal different parts of the same aerosol.
- PM0.5 = 1,200 #/cm³ is a particle count.
- PM2.5 = 12 µg/m³ is an estimated mass concentration.
- The numbers 1,200 and 12 are not comparable and must not be added.
What the pattern can tell you
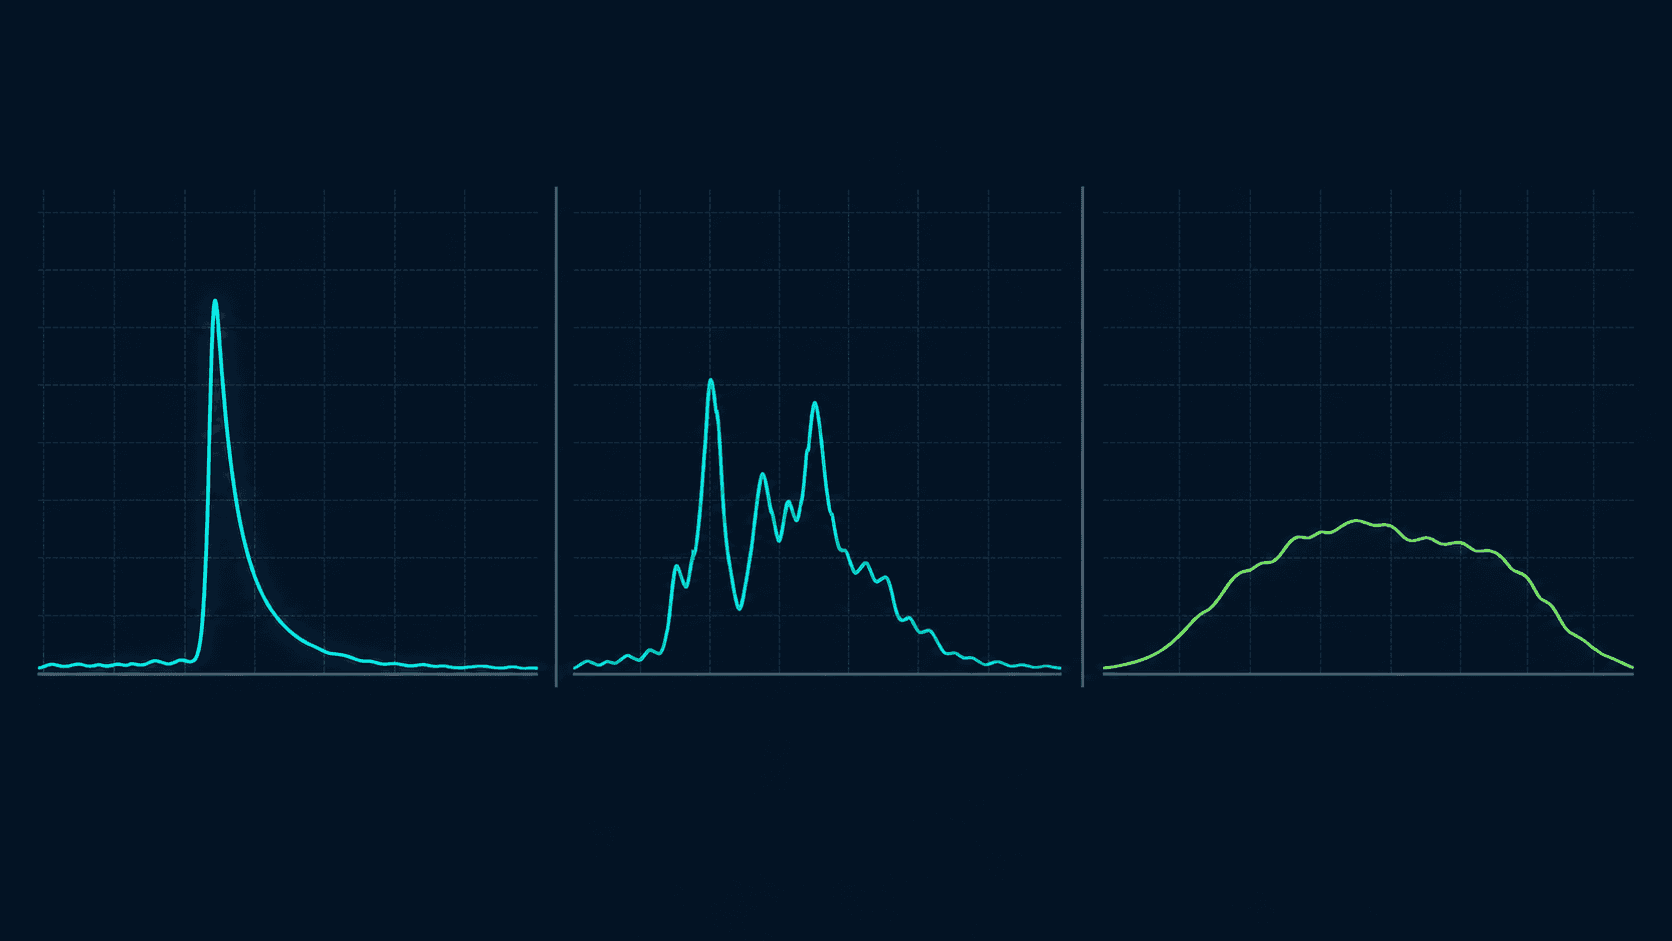
A single PM value cannot identify a source. The relationship between the channels is more useful.
PM0.5 count rises first
A sharp increase in small-particle count, followed by a more modest change in PM1 or PM2.5 mass, can accompany a fresh fine aerosol. Cooking, combustion and some workshop processes can produce this shape. It is a clue, not chemical identification.
PM1 and PM2.5 rise together
Fine particles are probably driving the event. Frying, candles, smoke entering from outside and some power-tool or printing processes can all do it. Room context matters more than guessing from the graph alone.
PM4 and PM10 move more strongly
Coarse material may be playing a larger role. Walking on a dusty floor, making a bed, sanding, sweeping or opening a window near an outdoor dust source can resuspend larger particles.
Everything stays elevated
Look for a continuing source, poor removal, or polluted outdoor air entering the building. Compare the timing with cooking, cleaning, occupancy, ventilation and trusted local outdoor-air data.
The monitor cannot tell soot from oil droplets or ordinary-looking dust from a more concerning material. If the source is unknown, unusual or work-related, investigate the activity rather than diagnosing chemistry from five numbers.
Which reading matters most for health?
There is no honest one-word answer. Particle size affects where particles can travel in the respiratory system, but health relevance also depends on what they contain, how much is present, and how long someone is exposed.
The US EPA notes that fine particles can reach deep into the lungs and some can enter the bloodstream. People with heart or lung disease, children and older adults can be more vulnerable. A consumer monitor cannot turn one indoor peak into a medical diagnosis or declare a room safe.
PM2.5 and PM10 have the clearest public guidance because they are widely measured in population-level air-quality programmes. The 2021 WHO Air Quality Guidelines recommend:
| Fraction | Annual average | 24-hour average |
|---|---|---|
| PM2.5 | 5 µg/m³ | 15 µg/m³ |
| PM10 | 15 µg/m³ | 45 µg/m³ |
These are ambient air-quality guidelines, built around annual and 24-hour exposure. They are not instant indoor alarm thresholds. A ten-minute cooking peak and a neighbourhood remaining polluted for weeks are not equivalent exposures, even if one snapshot shows the same value.
WHO does not provide matching guideline numbers for PM0.5, PM1 or PM4. That does not make those fractions harmless. It means we should not invent a health threshold where an authoritative one does not exist.
How an optical PM sensor measures invisible particles
Compact PM sensors do not collect every particle and weigh it. They move air through an optical chamber, shine light across it and measure how particles scatter that light. An algorithm then estimates particle-size distribution and mass.
That method is useful for continuous room trends, but it has limits:
- particles of different shape, colour and composition scatter light differently;
- high humidity and droplets from steam or some humidifiers can affect readings;
- contamination in the optical path can create drift;
- the conversion from scattered light to mass relies on a particle model;
- two monitor models can disagree while still showing the same event clearly.
Aura AQ uses the Sensirion SEN66 for its standard particle channels. Sensirion publishes PM1, PM2.5, PM4 and PM10 mass outputs. Its datasheet explains that PM4 and PM10 are calculated from the measured distribution, which is one reason not to treat the last decimal place as laboratory truth.
Use the monitor for repeatable context: the same room, the same position, and changes over time. Regulatory, occupational or legal evidence requires the sampling method and calibrated instrument specified for that job.
What to do when particles rise
Start with the source. A purifier is useful, but it should not become a very expensive apology for avoidable emissions.
- Check what just happened. Cooking, a candle, cleaning, sanding, printing, an open window or a nearby outdoor event may explain the timing.
- Stop or contain the source when possible. Put lids on pans, stop burning, close the workshop enclosure, or move a dusty task outside.
- Use extraction at the source. A cooker hood vented outdoors or local workshop extraction usually beats cleaning the whole room afterwards.
- Ventilate only when outdoor air is cleaner. A window helps an indoor cooking event but may make things worse during wildfire smoke or heavy outdoor pollution.
- Run suitable filtration. A correctly sized particle air cleaner can reduce airborne PM. It supplements source control; it does not replace it.
- Watch the decay. A falling graph shows removal winning. A flat high line means the source continues or the room is clearing slowly.
A safe little experiment is to use an activity that already happens normally. Mark when cooking starts and stops, then repeat the same meal another day with extraction running from the beginning. The two curves will teach you more than a universal colour band.
Where to place the monitor
For a representative room reading, keep the monitor in the occupied area and give air space around its inlet. Avoid placing it directly beside:
- a hob, candle, printer, laser cutter or sanding station;
- an open window, outside door or supply vent;
- a shower, kettle, ultrasonic humidifier or other droplet source;
- a floor, dusty shelf or spot that is disturbed frequently.
Direct placement near a source is useful when you are deliberately testing that source. It is poor placement when you want the normal room picture. Decide which question you are asking before moving the sensor.
Leave it in one position long enough to build a baseline. Otherwise you may spend the day measuring your own relocation decisions.
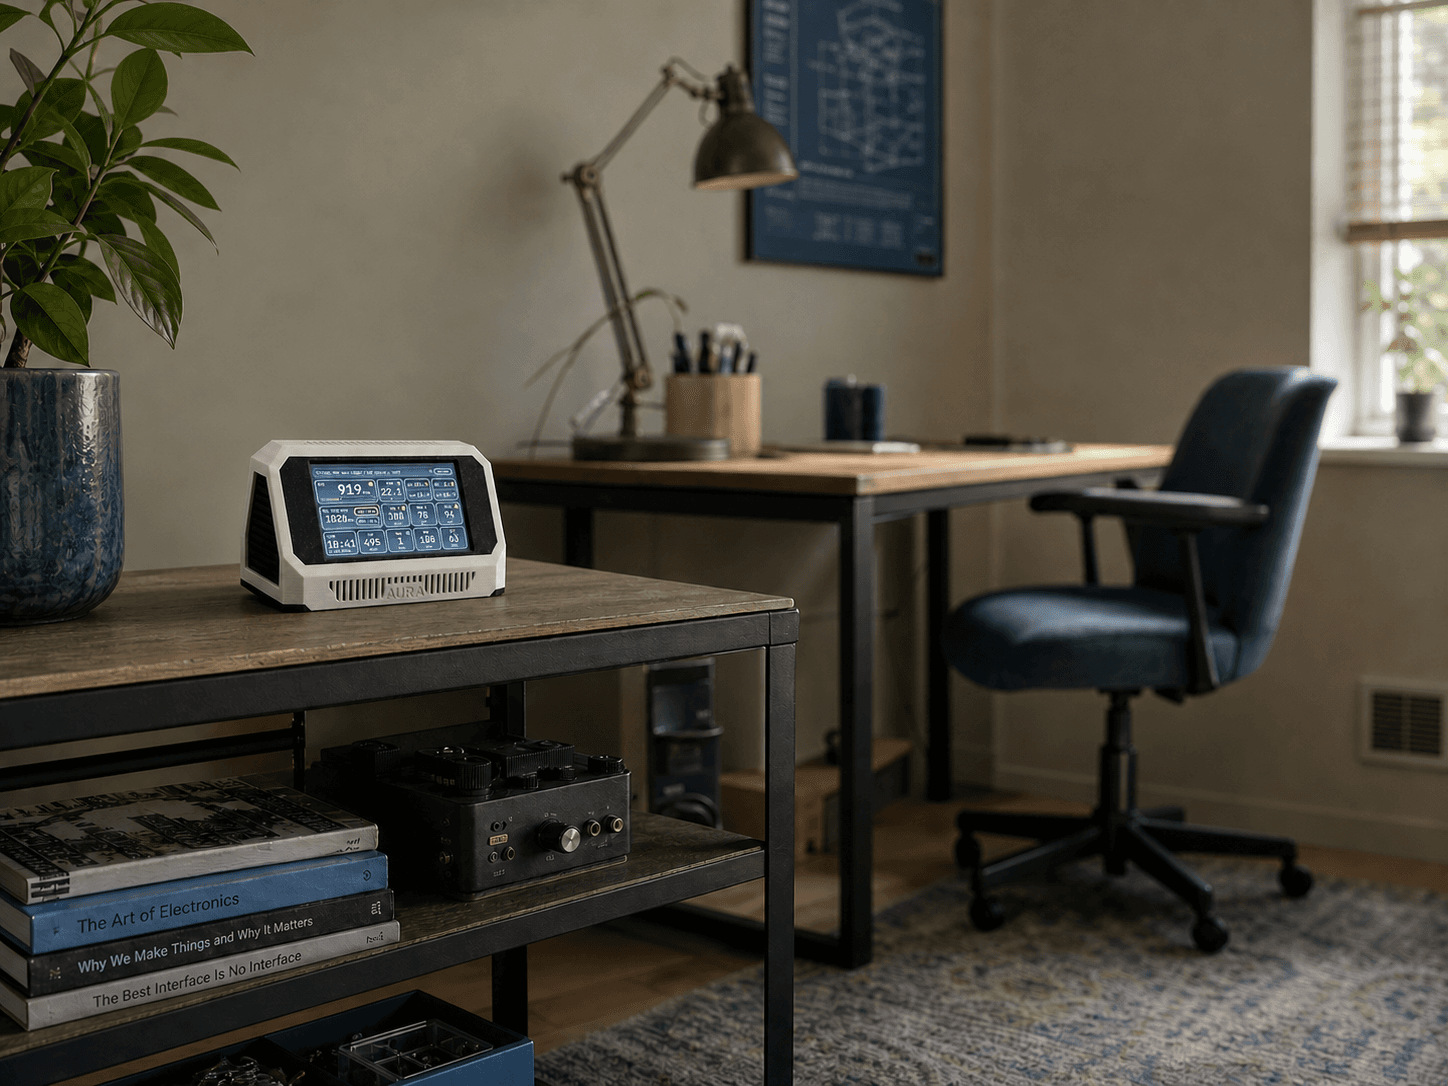
The useful habit: read the event, not one tile
When PM rises, ask four questions:
- Which channels moved first and which moved most?
- What changed in the room at that time?
- Did the event end when the activity stopped?
- Which action made the graph fall fastest?
That turns five intimidating labels into a practical feedback loop. The smallest particle is not automatically the only one worth watching, and the largest displayed number is not automatically the greatest risk. Read the units, pattern, duration and room together.
Explore each particle fraction
This guide gives the shared map. The next guides will look more closely at what each channel can reveal, where it becomes uncertain, and which indoor events are useful to test.
| Future guide | What it will answer | Status |
|---|---|---|
| Learn more about PM0.5 | Small-particle count without confusing it with ultrafine measurement | Planned |
| Learn more about PM1 | Fine indoor aerosols from cooking, smoke and workshop activity | Planned |
| Learn more about PM2.5 | Health guidance, exposure duration and a practical indoor response | Planned |
| Learn more about PM4 | What the respirable convention means and where it is useful | Planned |
| Learn more about PM10 | Coarse dust, resuspension and the limits of one room sensor | Planned |
Each title will become a link when its full, source-checked guide is published.
Frequently asked questions
Does PM2.5 include PM1?
Yes. The fractions overlap. Particles represented in PM1 also sit within the broader PM2.5 fraction, so the mass readings must not be added together.
Why is PM0.5 shown as count while the others use µg/m³?
Very small particles can be numerous while contributing little mass. Count makes that activity visible. PM1, PM2.5, PM4 and PM10 are commonly reported as estimated mass concentrations.
Is PM0.5 the same as ultrafine particles?
No. The EPA generally describes ultrafine particles as smaller than 0.1 micrometres. PM0.5 covers a broader submicron range, and a consumer optical sensor is not a dedicated ultrafine-particle counter.
Is PM4 a safety limit for my home?
No. PM4 roughly resembles the occupational respirable sampling fraction, but that convention does not create a household safe or unsafe threshold. WHO publishes guideline values for PM2.5 and PM10, not PM4.
Why does cooking create so much PM2.5?
Heating oils and food can create fine droplets and particles. The amount depends on the food, oil, temperature, appliance and extraction. The timing and decay can help you test whether local ventilation is working.
Can a humidifier cause a particle spike?
Yes, especially an ultrasonic humidifier using mineral-containing water. Droplets and dried minerals can scatter light in an optical sensor, so check humidity, device type and timing before assuming the reading is smoke.
Will a HEPA air cleaner lower PM readings?
A suitably sized and operated particle filter can lower airborne PM. Results depend on airflow, filter condition, room mixing and whether the source is still active. Source control and extraction usually come first.
Can Aura AQ tell me exactly what the particles are?
No. It measures optical behaviour and estimates size fractions; it does not identify chemical composition. Suspicious workplace or process-related exposure needs the correct professional sampling method.
Sources and further reading
This guide was checked against primary and authoritative material. Links were accessed on 1 August 2026.
- World Health Organization: Global air quality guidelines (2021)
- US EPA: Indoor Particulate Matter
- US EPA: Sources of Indoor Particulate Matter
- US EPA: What is Particle Pollution?
- US EPA: Frequent Questions About Air Sensors
- US EPA: Guide to Air Cleaners in the Home
- NIOSH: Factors Affecting Aerosol Sampling
- Sensirion: SEN66 environmental sensing platform
- Sensirion: SEN6x datasheet
Educational information only. It is not medical advice, an occupational exposure assessment or a substitute for required safety equipment and professional testing.